Single Outlier At End Point
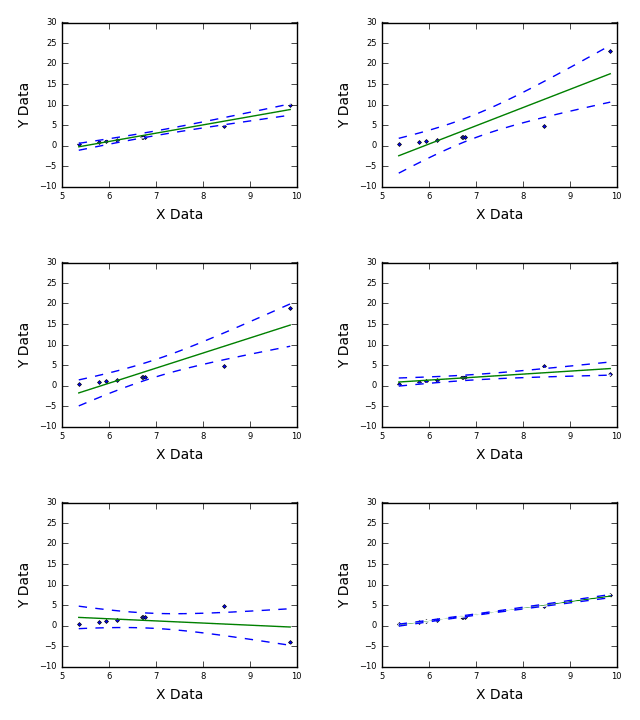
High resolution animation
and still images
errors in recording experimental data.
Single Outlier At Mid Point
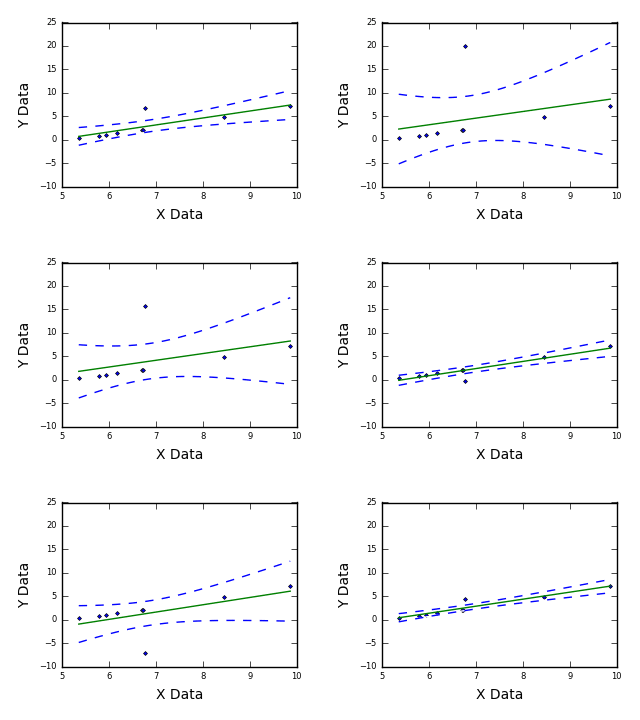
High resolution animation
and still images
errors in recording experimental data.
Fitting Parallel Data
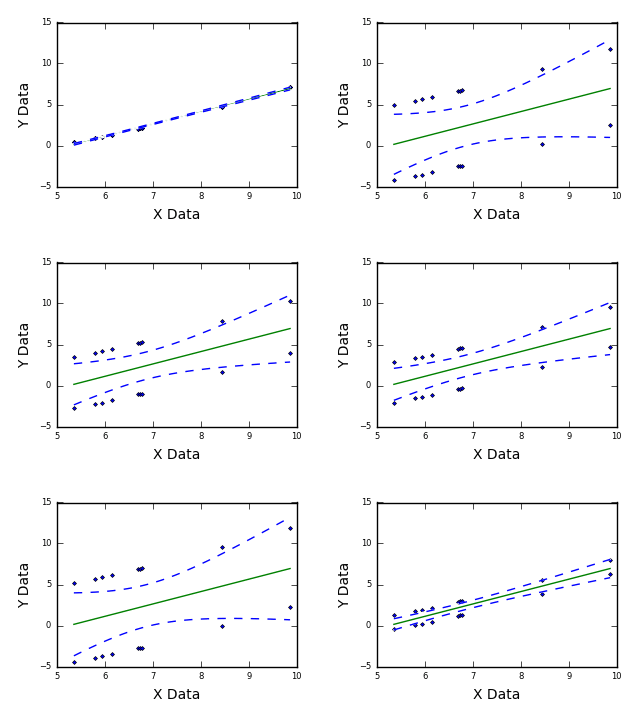
High resolution animation
and still images
changes during data collection, such as
temperature changes on different days
when making multiple data collection runs.
Data With A Large Step
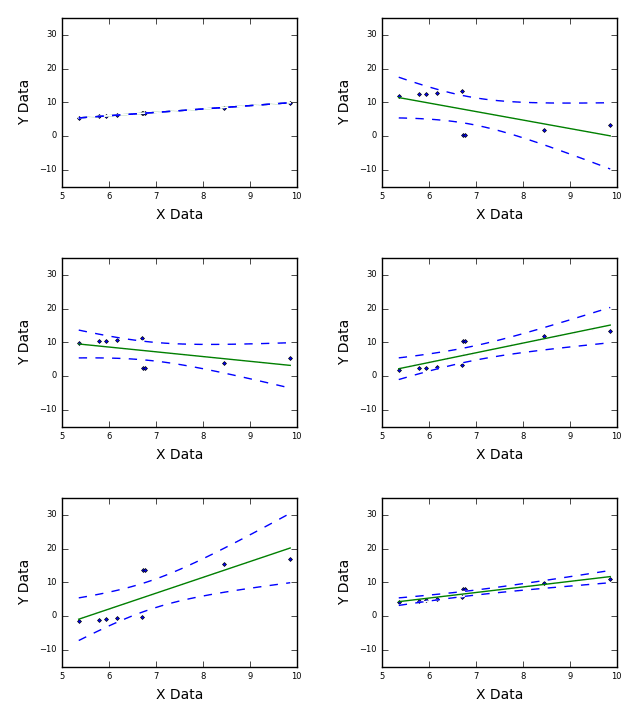
High resolution animation
and still images
changes during data collection such as a
temperature change during a lunch break.
Data With A Poorly Defined Region
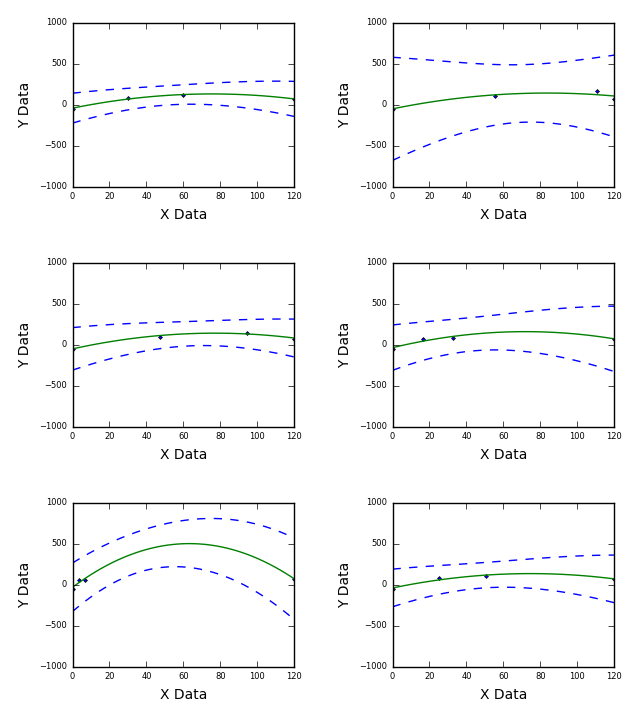
High resolution animation
and still images
data in the region that is poorly defined.
Equation Missing An Offset
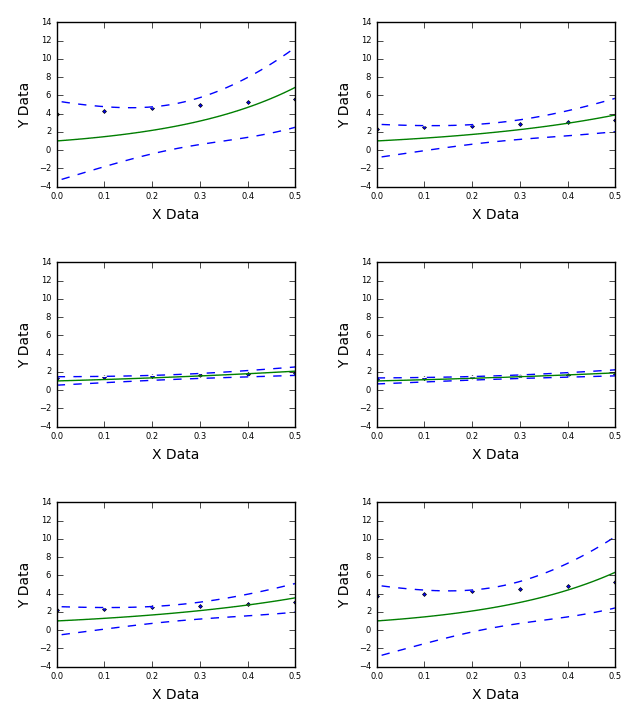
High resolution animation
and still images
an offset to an equation that does not have one.
This can be caused by experimental equipment
introducing bias (such as a DC offset) during
data acquisition. Fitting the data to an
equation with an offset will reveal the bias.
Data Scatter Over Entire Range
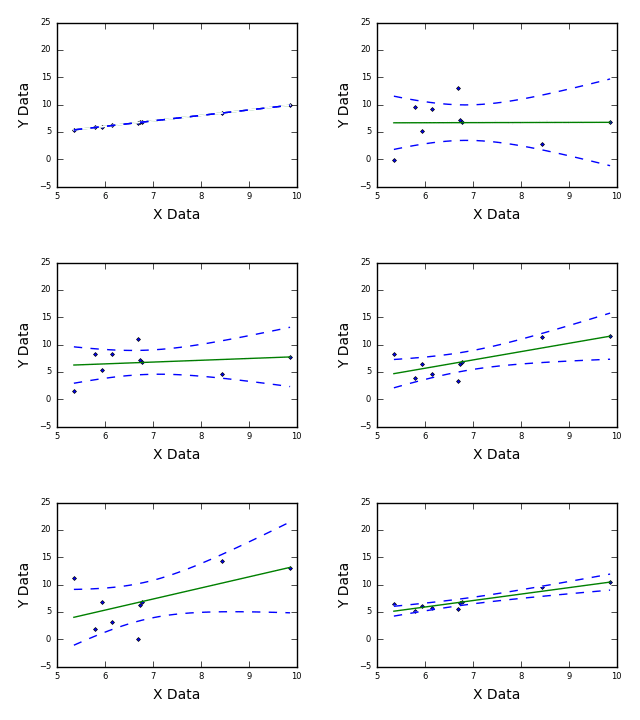
High resolution animation
and still images
by increasing the total number of data points.
Fitting Random Data
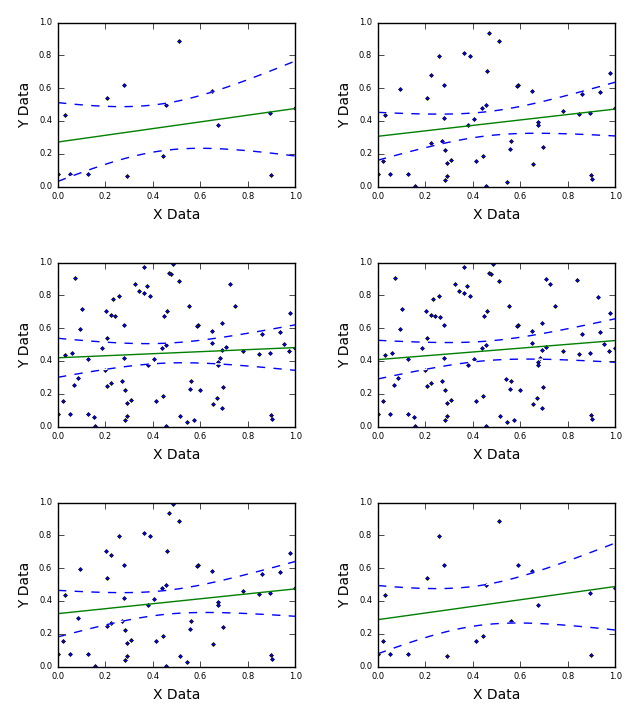
High resolution animation
and still images
random data that has no relationship of any kind.